|
LITHUANIAN QUARTERLY JOURNAL OF ARTS AND SCIENCES
|
ISSN
0024-5089
Copyright © 2008 LITUANUS Foundation, Inc.
|
|
Volume 54, No 4 - Winter 2008
Editor of this issue: M. G. Salvėnas
|
|
The Lithuanian Language in the
United States: Shift or Maintenance?
Aurelija Tamošiūnaitė
Aurelija
Tamošiūnaitė is a Ph.D. student in the
Department of Slavic & Baltic Languages and Literatures at the
University of Illinois at Chicago. Her areas of scholarly interest are
sociolinguistic history of the Lithuanian language, history of standard
languages, sociolinguistics, and Lithuanian language in the U.S.
Abstract
According to United States Census data (2000), there were 38,295 people
in the United States that speak Lithuanian. Almost 90 percent of
Lithuanian speakers in the U.S. declared that they speak English
„very well“ or „well“, and only
10 percent – „not well“ or „not
at all“. Thus data significantly point to a language shift
from Lithuanian to English among Lithuanian speakers in the U.S. Since
there are only a few studies conducted on Lithuanian language in the
U.S. or studies that investigate generational language shift among
Lithuanian speakers, but there is no reliable evidence to confirm the
shift of language or generational loss. In this article signs of shift
and maintenance among Lithuanian speakers, based on a study conducted
in two Chicago-area Lithuanian Saturday schools (in Gage Park and
Lemont), using self-report questionnaires, are presented with
conclusions.
Introduction
According to the United States Census
data, in 2000 there were almost
660,000 people of Lithuanian descent living in the United States.
Compared to other ethnicities, Lithuanian is a very small ethnic group,
forming only 0.2 percent of the total U.S. population. In addition, of
the 660,000 Lithuanian-descent Americans, the 2000 census shows only
38,295 Lithuanian speakers. This indicates that only 5.8 percent of
people declaring Lithuanian ancestry actually speak Lithuanian.
Although this number is small, one should keep in mind that the entire
population of Lithuania consists of just over 3 million people,
according to the Department of Statistics of the Republic of Lithuania.
This is almost ten times less than the number of Spanish speakers
living in the U.S. (35.3 million, 2000 United States Census).
Between 1990 and 2000, the number of
Lithuanian speakers in the U.S.
population decreased by 10 percent, from 0.024 to 0.014. Despite the
fact that there are more people declaring their Lithuanian ancestry
(the 1990 census indicates 526,089 people with Lithuanian descent, the
2000 census – 659,992), the number of speakers is
diminishing: in 1990 there were 55,781 Lithuanian speakers, while the
2000 census counts only 38,295 of them. In the 2000 census, almost 90
percent of Lithuanian speakers in U.S .declared they spoke English
“very well” or “well”,
and only 10 percent –
“not well” or “not at all”.
Thus the data points to a significant language shift from Lithuanian to
English among Lithuanian speakers in the U.S. Since there are almost no
studies done on Lithuanian language maintenance in the U.S., nor any
studies investigating generational language shift among Lithuanian
speakers, there is no reliable evidence to confirm the shift of
language or generational loss. Therefore in this paper I will try to
present the signs of maintenance or shift in the usage of Lithuanian
and English, based on a study conducted in October 2007 in two
Chicago-area Lithuanian Saturday schools.
Overview of
sociolinguistic literature on American
Lithuanian
There are only a few studies done on
American Lithuanian. In several
articles Lionginas Pažūsis (1973, 1988) focused more on lexical
(English semantic loans) and phonological differences (the distinction
between hard and soft consonants among American Lithuanians, as well as
aspiration at the word initial position that is not common for Standard
Lithuanian, etc.) between Standard Lithuanian and American Lithuanian.
However, other sociolinguistic issues were not addressed in his
studies.
In her dissertation, Jolanta
Macevičiūtė (2000) focused on the loss of
the distinction between registers in American Lithuanian and Full
Lithuanian, as she named “the language variety spoken
natively by its speech community in the Republic of
Lithuania” (Macevičiūtė 2000, 4). According to her
observations, Lithuanian language among American Lithuanians is used
only in some registers of speech, mostly in those that are related to
home, family or any Lithuanian community issues. Any change in topic
during the conversation (e.g., to business) usually signals a switch to
English. (Macevičiūtė 2000, 23).
She analyzed two types of registers:
written and spoken, for both
American Lithuanian and Full Lithuanian. American Lithuanian data
represents second-generation speakers, born in the U.S. to parents of
the post-World War II immigration.
62
One of the main observations between the first (G1) and second (G2)
generation speakers she made is that G2 usually do not command the
written register of Lithuanian. Another observation, related to the
lexico-grammatical level, is the loss of the genitive in negation;
accusative is used instead. Due to language contact, there are a number
of English borrowings that usually take the Lithuanian suffixes and
endings in order to conform to the rules of Lithuanian language
morphology. Direct translations of some terms whose equivalents are not
known to American Lithuanian speakers (2000, 32–35), as well
as some differences in sentence structure, such as loss of word order
variation and a decrease in object fronting construction, were observed
(2000, 86). However, the issue of the third generation (G3), and the
loss or maintenance of the language in this generation, is not
addressed in her dissertation.
A study by Algis Norvilas on language
choice among young Lithuanian
bilinguals (1990), although it was done within the framework of
phenomenological psychology, provides us with useful data on the usage
of Lithuanian in the U.S. In this study, Norvilas interviewed 19 women
and 20 men, giving them questionnaires asking why, when, under what
circumstances, and what language do they use when speaking to a young
Lithuanian who is bilingual. The average age of the respondents was
18–19 years; all of respondents lived in the vicinity of
Chicago, Illinois; all of them were G2 speakers, i.e., the children of
the second wave immigrants; almost all of them were graduate students,
belonged to Lithuanian organizations; and all “identified
Lithuanian as the first language they had learned” (Norvilas
1990, 218). However, the majority of respondents felt more comfortable
speaking English. The ability to speak and understand Lithuanian was
higher than the ability to read and write. Most of the respondents
indicated that they used Lithuanian more with their parents; whereas,
with their siblings or friends they tended to use English more
(Norvilas 1990, 218). Thus, this points very clearly to a shift to
English.
The results of the research provided
not only demonstrated the choice
between languages, but also revealed different at63
titudes toward English and Lithuanian as well. English usually was
considered “natural” and
“automatic”, while Lithuanian was marked by a sense
of a lack of proficiency. If Lithuanian was associated with positive
feelings such as pride, English did not have any sentiments attached to
it (Norvilas 1990, 222). Usually English is preferred in these
situations: when meeting a person for the first time, when the
person’s ability to speak Lithuanian is not strong, when an
American (third party) is present in the conversation, at the
University, and when the speaker himself feels his knowledge of
Lithuanian is limited. Lithuanian is preferred: with close friends,
with someone who starts speaking Lithuanian first, with someone who is
fluent in Lithuanian, with older people (out of respect for them), at
Saturday school (and other Lithuanian organizations or places), when
they do not want to be understood by others (English
speakers).
The study by Norvilas (1990) is
important because it shows clearly the
signs of language shift toward English among G2 Lithuanian bilinguals.
The division between language choice toward older people and peers is
especially important here, as well as the fact that almost all
respondents stressed the “naturalness” of English,
as the language that is easier to speak and to think in. This fact
indicates that the natural choice between languages is much more in
favor of English than Lithuanian. However, this study was conducted in
the early 1990s and does not provide data on the third generation
(G3).
The case of two Chicago-area Lithuanian
Saturday schools methodology and data
This study comparing attitudes toward
the Lithuanian language and the
choice of Lithuanian and English among teenage American Lithuanian
speakers was conducted in two Lithuanian Saturday schools. One school,
the Chicago Lithuanian School, is located in the city of Chicago, and
the other, Maironis Lithuanian School, is located in Lemont, one of the
southwestern suburbs of Chicago with a high concentration of
Lithuanians. One of the reasons why these two schools were
64
chosen was the high number of schoolchildren attending these schools.
During the 2006–2007 school year, there were 320 students in
the Chicago Lithuanian School and 493 students in the Lemont-based
school (figures provided by the Lithuanian Educational Council of the
USA). Another reason why these two schools were chosen is because of
the different immigration patterns they represent. In the Chicago
Lithuanian School, most of the students are the children of recent
immigrants (third wave) from Lithuania, thus, most of them were born in
Lithuania, i. e. they are G1 and G1.5 speakers.1
In contrast, the
background of the students in Lemont is much more diverse: the
representatives of all three generations can be found here (G1, G1.5,
G2, G3).
Since the purpose of this research
was also to compare the results with
those of Norvilas (1990), only the students from the highest grades (8,
9, 10) in both schools were interviewed. Self-report questionnaires
were given to the students in each school. The questionnaire was
created using Norvilas’s data (1990) as well as the sample of
a similar study conducted by Potowski with Spanish college students in
Chicago (Potowski 2004). The questionnaire consists of three parts. The
first part of the questionnaire provides the basic sociological
information about the respondent (age, sex, place [country] of birth,
etc.) In the second part, the students are asked to fill in two tables
with an approximate percentage of their usage of Lithuanian and English
with their parents, brothers/sisters (i.e. people they live with at
home) as well as grandparents, aunts, and cousins. Several questions on
language choice with multiple choice answers are also provided in this
part. In the third part of the questionnaire, students provided
information on their parents’ place of birth (to find out
what generation of Lithuanian speakers they belong to) and evaluated
their knowledge of English and
Lithuanian.
Students
(Respondents)
The questionnaire was completed by 82
(42 female and 40 male) students.
45 students were from the Chicago Lithuanian School, and 37 from
Maironis Lithuanian School in Lemont. The average age of the
respondents was 14.2 years. 76 percent (62) of all respondents were
born in Lithuania, and 24 percent (20) in the U.S. From those who were
born in the U.S. almost 80 percent of their parents were born in the
U.S., the remaining 20 percent were born in Lithuania, and one father
was born in Germany. Of those who were born in Lithuania, the age at
arrival is given in Table 1.
Table
1: Respondents’ age at arrival
|
Age
at arrival
|
|
Before
3
|
3–5
|
5–10
|
Over
10
|
Total
|
|
0%
0
|
21%
13
|
51%
31
|
28%
18
|
100%
62
|
As the table shows, most of the
respondents came to the U.S. between
the ages of 5 and 10. However, those respondents who came after the age
of 10 should be more fluent in Lithuanian compared to the others, since
they started school back in the country of origin. One would also
expect that teenagers, who came to U. S. when they were older than 10,
would rate their Lithuanian better than English, and will not be so
fluent in English, when compared to younger immigrants.
Table 2: Number of years in
the U.
S.
|
Number of years
|
|
Less than
3 years
|
3–8
|
8–12
|
Over 12
|
Total
|
|
14%
9
|
52%
33
|
32%
19
|
2%
1
|
100%
62
|
Most of the respondents reported that
they have been in the U. S. from
3 to 8 years. This indicates that the majority of students belong to
the third wave of immigrants, pointing to the importance of the influx
of new immigrants in helping to maintain the Lithuanian
language in the U. S. The majority of the
students are the children of recent immigrants, rather than the
children of previous immigrants.
The different pattern of generations
in the two Chicago area schools is
given in Table 3.
Table
3: Respondents by generation in two Chicago area
Lithuanian Saturday schools
|
Chicago
Lithuanian
School
|
Maironis
Lithuanian
School
|
Both
schools
|
|
Generation
|
Number
of respondents
|
Generation
|
Number
of respondents
|
Total
number of respondents
|
|
G1
|
9
(20%)
|
G1
|
3
(8.1%)
|
12
(14.63%)
|
|
G1.5
|
27
(60%)
|
G1,5
|
11
(29.72%)
|
38
(46.34%)
|
|
G2
|
8
(17.7%)
|
G2
|
8
(21.62%)
|
16
(19.51%)
|
|
G3
|
1
(2.2%)
|
G3
|
15
(40.54%)
|
16
(19.51%)
|
|
Total
|
45
(100%)
|
Total
|
37
(100%)
|
82
(100 %)
|
The data in the table indicates that
in the Chicago Lithuanian School
the majority of the respondents belong to the G1.5 group, whereas in
Maironis Lithuanian School there is a preponderance of G3. Thus, these
two schools represent different generations and different immigrant
groups. Most of the respondents in the Chicago Lithuanian School belong
to the recent wave of immigrants from Lithuania (thus, most of them
were born in Lithuania), while in Maironis Lithuanian School there are
more G3 students, whose grandparents belong to the second immigration
wave from Lithuania. This can be explained by the fact that many
second-wave immigrants and their children are concentrated in Lemont
and other nearby suburban areas, while third wave immigrants tend to
bring their children to the Chicago Lithuanian School (personal
communication with the administrator of the Chicago Lithuanian School).
However, the total percentage of G3 respondents in both
schools is only 19.5%, whereas 60.97% of all respondents belong to
G1 and G1.5. This indicates that the majority of students in these two
schools are recent newcomers rather than G2 and G3. Thus, there is a
horizontal pattern of language maintenance, since the percentage
diminishes from one generation to another.
Findings
Students had to provide the
percentage of their use of Lithuanian and
English to and from parents, siblings, grandparents, and other
relatives or friends. The usage of Lithuanian language twhen speaking
to parents is given in Table 4.
Table 4: Percent of
Lithuanian language
use to/from parents
|
No.
of years
in US
|
To
mother
|
From
mother
|
To
father
|
From
father
|
To
parents
|
From
parents
|
|
Fewer
than 3 (9)
|
99.20%
|
99.40%
|
99.14%
|
100.00%
|
99.18%
|
99.68%
|
|
3
to 8 (33)
|
97.12%
|
98.54%
|
99.34%
|
99.51%
|
98.23%
|
99.03%
|
|
8
to 12 (19)
|
95.20%
|
98.60%
|
95.90%
|
98.90%
|
95.58%
|
98.76%
|
|
Over
12 (21)
|
73%
|
77%
|
79.60%
|
78.70%
|
76.33%
|
78.00%
|
|
Average
(82)
|
91.13%
|
93.39%
|
93.50%
|
94.28%
|
92.33%
|
93.87%
|
The data is presented according to
the amount of the time respondents
spent in the U.S. The students’ use of Lithuanian does not
differ significantly when speaking to their mother or father. Only the
respondents who had been in the U.S. for more than 12 years (i.e.,
respondents who were born in the U.S.) showed a decrease in Lithuanian
use both to and from parents. However, for the other groups, the use of
Lithuanian is quite high. The average percentage to parents is 92.33
and from parents 93.87. The gap between the parents’ use of
the language to children and the children’s use to parents
does not differ significantly. This is different from the study done
with Spanish speakers, where the gap between the use of Spanish by
parents and children was the greatest when they had spent more than 12
years in the U. S. (Potowski 2004, 15).
With siblings
Table 5: Percent of Lithuanian spoken
to/from siblings
|
Amount
of time
in US
|
To
brother
|
From
brother
|
To
sister
|
From
sister
|
To
siblings
|
From
siblings
|
|
Fewer
than 3 (9)
|
90%
|
90%
|
99.20%
|
98.80%
|
97.66%
|
97.33%
|
|
3
to 8 (33)
|
96.11%
|
89.78%
|
96.87%
|
95.50%
|
96.34%
|
90.59%
|
|
8
to 12 (19)
|
90%
|
83.70%
|
75.60%
|
81.80%
|
88.73%
|
82.94%
|
|
Over
12 (21)
|
59.90%
|
57.90%
|
62.10%
|
60.20%
|
60.80%
|
77.83%
|
|
Average
(82)
|
84%
|
80%
|
83.44%
|
84.08%
|
85.88%
|
87.17%
|
Table 5 represents the
respondents’ use of Lithuanian to and
from their siblings. The average percent to siblings is 86%, and from
siblings 87%. However, in contrast to the use of Lithuanian with
parents, here the usage of the language drops significantly when the
respondents spend more time in the U.S., thus the length of the stay in
the U. S. is correlated with a less frequent use of Lithuanian. This is
particularly noticeable with respondents who have spent more than 12
years in the U.S. Of note is that the gap between Lithuanian use to and
from siblings is almost zero for those who are in the U.S. fewer than 3
years. However, for two groups (3–8 and 8–12) the
gap is about 6 percent, indicating that respondents use more Lithuanian
when addressing their siblings than when the siblings are addressing
them. For the group of respondents who have spent more than 12 years in
the U. S. most of whom (80 percent) were born in the U.S. the gap is
about 7 percent; however, in this case it indicates that students use
Lithuanian less often when they speak to their siblings than their
siblings use when they speak to them. This gap could be explained by
the age difference between siblings. They could use more Lithuanian
with older siblings, and less with younger.
Table 6: Percent of Lithuanian to/from parents
and to/from siblings
|
Amount of time
in US
|
To
parents
|
From
parents
|
To
siblings
|
From
siblings
|
|
Fewer than 3 (9)
|
99.18%
|
99.68%
|
97.66%
|
97.33%
|
|
3 to 8 (33)
|
98.23%
|
99.03%
|
96.34%
|
90.59%
|
|
8 to 12 (19)
|
95.58%
|
98.76%
|
88.73%
|
82.94%
|
|
Over 12 (21)
|
76.33%
|
78.00%
|
60.80%
|
77.83%
|
|
Average (82)
|
92.33%
|
93.87%
|
85.88%
|
87.17%
|
Table 6 represents a comparison of
the respondents’ language
use to/from parents and siblings. The difference between usage is not
significant for the first two groups (those who have been in the U.S.
less than 8 years), however, the usage of Lithuanian to siblings
diminishes for those who have spent 8 to 12 years in the U. S., and
even for those who have spent over 12 years. The data indicates that
respondents tend to use less Lithuanian with their siblings than with
their parents. However, the percentage of Lithuanian used with parents
and siblings is fairly high (more than 90 percent), thus, this points
to the maintenance of Lithuanian language in the home
setting.
Other
relatives
Table 7:
Percent of Lithuanian
use to/from other relatives
|
Amount
of time
in US
|
To
cousin
|
From
cousin
|
To
aunt,
uncle
|
From
aunt,
uncle
|
To
grand-
parents
|
From
grand-
parents
|
|
Fewer
than 3 (9)
|
93.33%
|
90%
|
99.80%
|
99.80%
|
99%
|
100%
|
|
3
to 8 (33)
|
95.80%
|
85.30%
|
99.93%
|
99.94%
|
100%
|
99.25%
|
|
8
to 12 (19)
|
40%
|
52.50%
|
100%
|
100%
|
100%
|
100%
|
|
Over
12 (21)
|
50.70%
|
51.40%
|
51.80%
|
43.10%
|
91%
|
92%
|
|
Average
(82)
|
69.96%
|
70%
|
87.88%
|
85.71%
|
98%
|
98%
|
Lithuanian use with other relatives
is similar to that of parents and
siblings, in the respect that the use is higher when the addressed
person is older. The highest percentage of Lithuanian language use is
with grandparents (average 98%), it diminishes when speaking to an aunt
or uncle (87.88%), and is the lowest
when speaking to cousins (69.96%). The decrease in the use of
Lithuanian to cousins is the highest for respondents who have spent
more than 8 years in the U. S. Usually cousins are close in age to that
of respondents or their siblings; therefore, this decrease in
Lithuanian use points to a shift to English.
Language
attitudes and language choice
As mentioned earlier, Norvilas
investigated language choice between
bilingual Lithuanians. Since one of the goals of the present study was
to compare language attitudes and use in Chicago-area schools to
Norvilas’s findings, the data represented below in Table 11
will show the language choice among respondents, i. e., when and why
they prefer to speak Lithuanian or English.
Table 8:
Language choice among respondents in
two settings
|
|
When you meet a
Lithuanian friend
who speaks both English and
Lithuanian, which language do you
speak to him?
|
What language do
you speak in
Lithuanian Saturday school during
the break?
|
|
Amount of
time in USA
|
Lithuanian
|
English
|
Both
|
Lithuanian
|
English
|
Both
|
|
Fewer
than 3 (9)
|
100%
(9)
|
0%
(0)
|
0%
(0)
|
88.88%
(8)
|
0%
(0)
|
11.11%
(1)
|
|
3 to 8 (33)
|
51.51%
(17)
|
3.03%
(1)
|
45.45%
(15)
|
63.63%
(21)
|
6.06%
(2)
|
30.30%
(10)
|
|
8 to 12 (19)
|
36.84%
(7)
|
21.05%
(4)
|
42.10%
(8)
|
47.36%
(9)
|
21.05%
(4)
|
31.57%
(6)
|
|
Over 12 (21)
|
9.52%
(2)
|
19.04%
(4)
|
71.42%
(15)
|
9.52%
(2)
|
38.09%
(8)
|
52.8%
(11)
|
|
Average
|
49%
|
11%
|
40%
|
52.35%
|
16%
|
31.34
|
Table 8 represents language choice between respondents in two settings:
when the respondent speaks to a Lthuanian friend who knows both
languages, and when the respondent speaks in Lithuanian Saturday school
during recess. In the first situation, Lithuanian is dominant only for
those respondents who have spent less than 3 years in the U.S. However,
other groups tend to use codeswitching more. The highest
percentage of both
languages used for a bilingual Lithuanian is among respondents who have
spent over 12 years in the U.S. Thus the data shows that the more time
respondents spend in the U.S., the more likely they will tend to use
both languages (i.e., codeswitch) when speaking to a Lithuanian friend.
The next situation shows a similar pattern, however, Lithuanian is
dominant for all groups except for those who were born in the U.S. or
spent more than 12 years there. This situation was chosen in order to
find out the natural choice of language in informal situations during
Lithuanian Saturday school, since during the classes children are
encouraged to speak Lithuanian. However, in this situation 52.35
percent of the respondents indicated they use Lithuanian. This confirms
Norvilas’s findings that in a Lithuanian setting, bilingual
Lithuanians tend to use more Lithuanian.
Norvilas did not provide statistical
data on language choice (how many
students named one or another reason) in his study, since the questions
for the respondents were given in open form. However, his research was
useful for the present study, since the answers provided by his
respondents were used as multiple choice selections in the
questionnaire. Table 12 represents the data on the conditions that
influence the language choice among Lithuanians in the present
study.
Table 9:
Conditions for using Lithuanian
|
What are the
conditions under which you prefer to speak Lithuanian?
|
Because it is
easier to express your thoughts
|
Because the
person you are talking to does not know English
|
Because the
person you are talking to does not have a sufficient knowledge of
English
|
Because your
knowledge of English is insufficient
|
|
Fewer than 3 (9)
|
100%
(9)
|
22.22%
(2)
|
33.33%
(3)
|
22.22%
(2)
|
|
3 to 8 (33)
|
66.66%
(27)
|
45.45%
(15)
|
48.48%
(16)
|
6.06%
(2)
|
|
8 to 12 (19)
|
57.89%
(11)
|
57.89%
(11)
|
68.42%
(13)
|
0%
(0)
|
|
Over 12 (21)
|
19.04%
(4)
|
71.42%
(15)
|
76.19%
(16)
|
9.52%
(2)
|
|
Average
|
61%
|
49.25%
|
56.61%
|
9.45%
|
As in the previous data sets, the data is presented according to the
respondents’ length of stay in the U.S. 100 percent of those
in the U.S. fewer than 3 years responded that they speak Lithuanian
because it is easier to express their thoughts; i.e., Lithuanian is the
more natural language for them. However, the longer respondents lived
in the U.S., the less often this reason was selected. In contrast, for
those who had spent more time in the U.S., the main reason to speak
Lithuanian was not natural choice but because the other person did not
have a sufficient or any knowledge of English. Thus, the data indicates
that there is a gradual shift to English that correlates with a longer
stay in the U.S. The Lithuanian language is used only if there is no
other possibility to use English; i.e., when it is necessary in order
to communicate sucessfully.
Table 10: Conditions for
preferring English
|
What are the
conditions that you prefer to speak English?
|
Because it is
easier to express your thoughts
|
Because the
person you are talking to does not know Lithuanian
|
Because the
person you are talking to does not have a sufficient knowledge of
Lithuanian
|
Because your
knowledge of Lithuanian is insufficient
|
|
Fewer than 3 (9)
|
22.22%
(2)
|
44.44%
(4)
|
44.44%
(4)
|
0%
(0)
|
|
3 to 8 (33)
|
30.30%
(10)
|
75.75%
(25)
|
42.42%
(14)
|
6.06%
(2)
|
|
8 to 12 (19)
|
63.15%
(12)
|
78.94%
(15)
|
42.10%
(8)
|
15.78%
(3)
|
|
Over 12 (21)
|
95.23%
(20)
|
80.95%
(17)
|
71.42%
(15)
|
19.04%
(4)
|
|
Average
|
52.73%
|
70.02%
|
50.10%
|
10%
|
Table 10 represents conditions when English is preferred. If Lithuanian
was preferred by all the respondents who arrived in the U.S. recently
as the language considered easier to express thoughts, for English we
see the opposite pattern – it is the natural choice (or it is
easier to express thoughts) for those who have spent more than 12 years
in U.S. However, if we look to the average (70,02%), the main reason
why respondents prefer to use English and not Lithuanian is because the
person they address does not speak Lithuanian.
Data only on the choice “Because it is easier to express your
thoughts” for Lithuanian and English is presented in the
following figure.
Language in which it is easier to
express thoughts
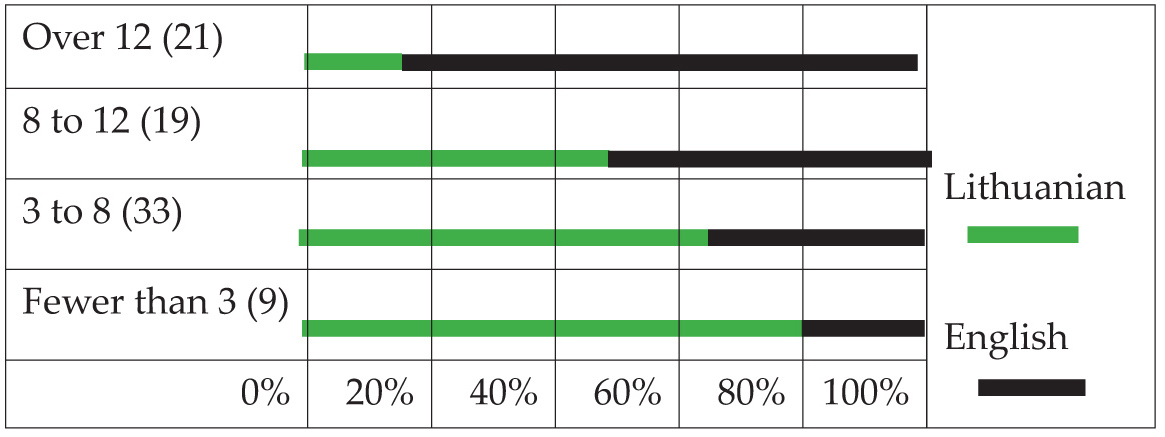
Majority of the respondents that
spent less than 8 years in the U. S.
indicated that Lithuanian is still the language of their natural
choice; i.e. it is easier to think in Lithuanian than in English.
However, for half of the respondents that have been in the U.S. for 8
to 12 years the choice was Lithuanian, and for another half –
English. Thus, I would argue, that the turning-point or rupture for the
shift from Lithuanian to English is between 8 and 12 years of stay in
the U.S.
Another multiple choice question
respondents were asked to answer was
related to the issue of identity; in other words, what are the
motivations to learn Lithuanian and whether speaking Lithuanian is part
of their Lithuanian identity.
Table 11:
Motivation to learn
Lithuanian
|
Why do you think
you need to learn Lithuanian ?
|
Because this is
the language of your parents
|
Because you are
Lithuanian
|
Because it is
better to know two languages (Lithuanian and English) than one (English)
|
|
Fewer than 3 (9)
|
77.77%
(7)
|
77.77%
(7)
|
55.55%
(5)
|
|
3 to 8 (33)
|
93.93%
(31)
|
93.93%
(31)
|
42.42%
(14)
|
|
8 to 12 (19)
|
78.94%
(15)
|
94.73%
(18)
|
78.94%
(15)
|
|
Over 12 (21)
|
100%
(21)
|
100%
(21)
|
100%
(21)
|
|
Average
|
87.66%
|
91.61%
|
69.23%
|
Overall, the data indicates that the main motivation why students study
Lithuanian is because they are Lithuanian (91.61 percent of all
respondents checked this answer). The second reason is because this is
the language of their parents. Slightly more than half the respondents
checked that it is better to know two languages rather than one. Of
those who have spent more than 12 years in the U.S., everyone checked
all the reasons. For those who have spent 8 to 12 years, the main
reason was because they are Lithuanian. Therefore, a possible
explanation could be that knowing Lithuanian is also a part of being
Lithuanian. The language seems to be an important issue when creating
identity.
Language
proficiency and language dominance
Table 12 represents the
students’ reported language
proficiency. There was a significant difference between Lithuanian and
English proficiency only for those respondents who came to the U.S.
recently. 88 percent of these respondents marked
“excellent” for Lithuanian, and 55 percent marked
“good” for English. There was no significant
difference in other groups, since most of them reported that their
knowledge of Lithuanian and English was “very good”
or “good”. However, this self-evaluation does not
prove the real proficiency of their Lithuanian and English, and a more
detailed study should be conducted in order to investigate the
respondents’ real proficiency.
Table 12: Self reported language
proficiency
|
Lithuanian
|
|
|
Excellent
|
Very good
|
Good
|
Not very good
|
Bad
|
|
Fewer than 3 (9)
|
88.88%
8
|
11.11%
1
|
0%
0
|
0%
0
|
0%
0
|
|
3 to 8 (33)
|
51.51%
17
|
51.51%
17
|
12.12%4
|
0%
0
|
0%
0
|
|
8 to 12 (19)
|
21.05%
4
|
47.36%
9
|
30,57%6
|
0%
0
|
0%
0
|
|
Over 12 (21)
|
19.04%
4
|
47.36%
9
|
38.09%8
|
0%
0
|
0%
0
|
|
Average
|
45.12%
|
39.34%
|
20%
|
0%
|
0%
|
|
English
|
|
|
Excellent
|
Very good
|
Good
|
Not very good
|
Bad
|
|
Fewer than 3 (9)
|
0%
0
|
33.33%
3
|
55.55%5
|
11.11%1
|
0%
0
|
|
3 to 8 (33)
|
27.27%
9
|
51.51%
17
|
18.18%6
|
3.03%
1
|
0%
0
|
|
8 to 12 (19)
|
47.36%
9
|
47.36%
9
|
5.26%
1
|
0%
0
|
0%
0
|
|
Over 12 (21)
|
57.14%
12
|
38.09%
8
|
0%
0
|
0%
0
|
0%
0
|
|
Average
|
33%
|
42.57%
|
19.75%
|
3.54%
|
0%
|
Table 13 below represents
self-reported language dominance among respondents. The data again
confirms the shift from Lithuanian to English, as well as a correlation
between length of stay in the U.S. and diminishing usage of Lithuanian.
The table shows nicely how dominant language changes depend on the
length of stay in U.S.: for recent immigrants and those who spent
3–8 years in the U.S., Lithuanian is still dominant. For
respondents who have spent from 8 to 12 years, the percentage of
Lithuanian and English is similar (42%), thus, this could again be the
turning-point for the shift from Lithuanian and English among teenage
American Lithuanians. No one from the last group reported Lithuanian as
their dominant language: 95 percent reported English, and only 5
percent reported the two languages as “equal”. This
points significantly to a shift to English, rather than
maintenance.
Table
13: Self reported language dominance
|
Which
language do you know better?
|
Lithuanian
|
English
|
Equal
|
|
Fewer
than 3 (9)
|
88.88%
(8)
|
0%
(0)
|
11.11%
(1)
|
|
3
to 8 (33)
|
72.72%
(24)
|
21.21%
(7)
|
3.03%
(1)
|
|
8
to 12 (19)
|
47.36%
(9)
|
42.10%
(8)
|
10.52%
(2)
|
|
Over
12 (21)
|
0%
(0)
|
95.23%
(20)
|
4.76%
(1)
|
|
Average
|
52.24%
|
40%
|
7.36%
|
Conclusion, further research
The data presented in this paper
points to a shift from Lithuanian to English among teenage Lithuanian
speakers in the U.S. As the study findings point out, there is a
correlation between the length of stay in the U. S. and the use of
Lithuanian: the longer respondents live in the U. S., the less
Lithuanian they use. The turning-point for the shift from Lithuanian to
English is indicated to be in the period between 8 to 12 years of stay
in the U. S.
The study in two Chicago-area
Lithuanian Saturday schools points to the importance of new immigrants.
These two schools represent a different generational pattern, since the
majority of the respondents in the Chicago Lithuanian School belonged
to G1 and G1.5, whereas in the Maironis Lithuanian School, all three
generations were represented. However, the small overall number of G3
respondents and the fact that the majority of the students in the
Chicago Lithuanian School are G1 and G1.5 indicates that Lithuanian is
not mainly maintained intergenerationally; therefore, there is
horizontal rather than vertical maintenance of the language. The influx
of new immigrants is one of the reasons why Lithuanian is still
maintained in the U. S. Thus, recent immigrants help to bolster the use
of Lithuanian in the U.S.
Although there are a number of
limitations to self-reported questionnaires (e.g., some of the
respondents could provide unreliable data because of a desire to please
the researcher), however, the percentage of Lithuanian usage was fairly
high (even to siblings the average was more than 80 percent). This
indicates that Lithuanian, at least among the respondents of this
study, is still highly used and maintained.
The data of this study confirmed some
of Norvilas’s 1990 findings on language choice among G2
Lithuanian bilinguals. Most of the respondents, similarly to
Norvilas’s findings, use Lithuanian mainly with grandparents,
parents, or with someone who does not speak English or has limited
knowledge of it, as well as in Lithuanian settings (more than 50
percent of the respondents pointed out that they speak Lithuanian
during recess in Lithuanian Saturday school). Most of
Norvilas’s respondents stressed the
“naturalness” of English, since it is easier to
express their thoughts in English. The present study showed a similar
pattern, depending on how long the respondents have been living in the
U.S. Lithuanian was the dominant language for recent newcomers, and for
those who were born here or spent more than 12 years here, the dominant
language is already English. More than 90 percent of these respondents
indicated that it is easier to express their thoughts in English. This
points significantly to a shift to English.The turning-point for the
shift was the period of 8 to 12 years of stay in the U.S.
Since the study conducted for this
paper still missed some aspects, further research could investigate
whether respondents plan to pass the language on to their children
(this will indicate whether they are going to maintain Lithuanian and
if yes, under what conditions and why), what their relationship with
Lithuania is (are they visiting it, how often, how long do they stay
there), do they use Lithuanian internet (do they chat online, do they
take part in forums, do they use Lithuanian letters when they use a
computer or not), when they read Lithuanian books, newspapers,
magazines, listen to Lithuanian pop music, and watch Lithuanian
television. A study on Lithuanian-Americans’ proficiency both
in English and Lithuanian would also be useful, since from the
self-reported data provided in this study their real proficiency
remains somewhat unclear.
1. G1 are those individuals that arrived
to the U.S. after 11 years of age, G2 – those who were born
in the U.S. to parents born abroad or those who arrived to the U.S.
before they were five years of age, and G3 are those born to U.S.-born
parents. All those that arrived in the U.S. between age 5 and 11 belong
to G1.5 (following Potowski 2004).
References
Department
of Statistics
of the Republic of Lithuania (2005). The number of total population for
the 3rd quarter of 2007. Accessed October 20, 2007 at
http://www.stat.gov.lt/lt/lt/
Macevičiūtė,
Jolanta, 2000. The
beginnings of language loss in discourse. A study of American Lithuanian.
USC dissertation.
Norvilas,
Algis, 1990. “Which language shall we speak? Language choice
among young Lithuanian bilinguals.” Journal of Baltic Studies,
vol. XXI, no. 3, 215-230.
Pažūsis,
Lionginas, 1973. “Anglų kalbos semantiniai skoliniai
Šiaurės Amerikos lietuvių kalboje.” Kalbotyra, vol. 26,
27-36.
Pažūsis,
Lionginas, 1988. “Anglų kalbos interferencija antrosios JAV
lietuvių kartos gimtosios kalbos tartyje.” Kalbotyra, vol. 39,
no. 1, 70-80.
Potowski,
Kim, 2004. “Spanish language shift in Chicago.” Southwest Journal of Linguistics,
23(1), 87-116.
The
Lithuanian
Educational Council of the USA. Accessed September 27, 2007 at
http://www.svietimotaryba.org/lietschools.html U. S. Census Bureau,
2000. Summary File 3. Accessed September 15, 2007 at:
http://factfinder.census.gov/servlet/DatasetMainPageServlet?_ds_name=DEC_2000_SF3_U&_program=DEC&_lang=en